Written By: Julie Burroughs + Kalia Garrido
We recently hosted a virtual event for 200+ people. The topic was failed dashboard adoption. The event was hosted by Lee Feinberg, a data literacy expert in the industry. It was well attended and Lee did a great job. A big part of his message was the fact that the technology is not to blame for low dashboard adoption. Instead, it is a lack of consistency and structure in how teams are using the software that results in low-to-no adoption across the company.
Although this was not the first time we’d unpacked dashboard adoption issues, it did get us re-thinking – perhaps it’s too broad to say “It’s not the technology” in a carte blanche, sweeping statement. There are so many different flavors of data and analytics technology available today. We are at a crossroads where the old, legacy tech is as available as the new tech, creating a situation in which different companies are likely using vastly different systems. That said, we support what Lee says about consistency, but would also introduce that low dashboard adoption could have something to do with the TYPE of technology the company has in place.
The Costs of Failed Dashboard Adoption
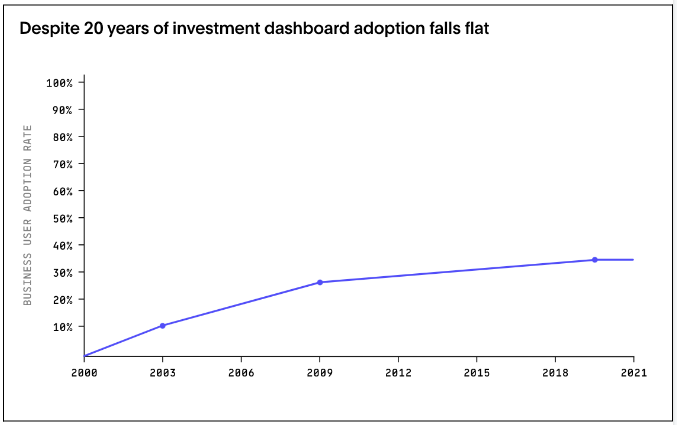
From there, we dug into the actual costs (and cost savings) involved. Current industry statistics estimate 70% of the development work that is used to build dashboards is wasted when the dashboard is not fully adopted by the business users that it is intended for. So, how much would a company save if they simply stopped building dashboards?
Let’s explore a common scenario: A BI developer goes to the business, tries to draw out the requirements and comes back days later with their first version of the dashboard. The business asks for revisions, the BI developer refines, and they meet again. This cycle can repeat for months. It costs the company time and money and chances are very high that the dashboard will not be fully adopted. What a waste.
Source: A Decade of Data eBook
The Economics of Failed Dashboard Adoption
So, let’s look at the math. According to Salary.com, on average, a BI Developer’s annual salary is $136,061 per year (including bonus and benefits). This will of course vary based on years of experience, location, and a variety of other factors, but for the sake of this exercise, let’s work with this number.
Based on the A Decade of Data graphic shown above, if dashboards get a maximum of 30% adoption, that would mean that the BI Developer is wasting 70% of their time. Annually, that equates to just over $95K per year that is out the window. Now consider the BI Developer, and the significant lack of job satisfaction and motivation they would feel knowing that the majority of their hard work has been pushed by the wayside. Wasted money and low morale – not a good recipe for a company that is trying to stay competitive in a volatile market.
What’s the Alternative?
We had our ah-ha! moment in late 2019 when we were introduced to the incredibly clean concept of “stop building dashboards”. When we dug into this, we saw a viable alternative that could be something as simple as giving your business users a “Google-like” search bar and letting them get their own answers to their questions. It took a bit of time before we were really bought in, but after seeing the power of this concept in action, we became true believers and haven’t looked back since. This is what we refer to as modern data discovery, using the power of natural-language search to answer your business questions.
For organizations that have their eye on self-service analytics and the democratization of their data, this approach and the technologies that support it are accelerators to creating a data-driven culture. The human resource savings can be reinvested in data literacy education, licensing to support “analytics for all”, data readiness and other strategic areas of your data program.
The Human Side of Failed Dashboard Adoption
Now, consider the human side of things. As a natural inclination, people are resistant to change. We see it over and over again in our modernization work. BI Developers are proud of their work, and rightfully so. They understand the data and are well-versed in developing functional and informative dashboards. We can all understand why they are often not ready to give up their years of investment in their art.
We see resistance to new technology all the time. As transformation coaches, we recommend strong communications from the start to really instill “the why” about the change that is taking place. We promote the use of sandbox environments that allow key stakeholders to experiment with the technology, allowing them to get fully on board with what’s new. Companies should also expect and prepare to work closely with the team members that are struggling the most (especially those that may feel like their jobs are at risk). In this case, the BI Developers specific skill set can be readily applied to taking a more strategic focus on the overall health, efficiency, planning and governance of the company’s data and analytics program.
Additional Considerations
In no way are we insinuating that your organizations should no longer use dashboards as a tool for decision making. We are making the case that it is not necessary to expend the resources to build the dashboards. Modern data discovery tools automatically build dashboards based on your query. At that time, you can decide if you would like to put them on a pinboard. These become live pinboards that change as the data is refreshed. The benefit of the dashboard is there for those that want to use them, without the effort of having to intensively build and maintain it.
Additionally, data discovery tools are fairly new to the market. Because of this, most were developed with foundational AI/ML. When we say “foundational” we mean from the ground up as an integral part of the functionality, not an add-on like you see some of the legacy BI tools that are attempting to integrate AI/ML now. The benefits with foundational AI/ML are many, especially the fact that key insights that you haven’t even asked for are intelligently served up. This is the wave of the future – innovative technology that assists you in uncovering key business insights. Very exciting for the data and analytics industry.
Finally, many of the technologies that support data discovery have focused on embedded (public-facing) solutions as the market trend of supplying external partners and customers with insights continues to grow. In the case of one of our customer’s, the use of data discovery was a key competitive advantage and allowed them to attract new customers based on the ease of use.
Recommendations for Moving Forward
Many savvy organizations today are taking a hard look at their BI licensing costs and other areas of possible savings. Even those that are using “free” licensing (and we all know free is not free) are uncovering hidden technology costs, along with human talent costs and employee dissatisfaction. Not an efficient or fun way to run a data and analytics program.
As we work with our clients to initiate their data discovery journey, we recommend starting with a single use case to prove out the technology and measure adoption success. We started working with what we consider to be the top data discovery technology in the marketing place, ThoughtSpot. Together we are partnering to enable organizations like Nike, Charter Communications, Frontier Communications, Optum and many others that choose to put on their innovation caps and adopt new ways to deliver analytics faster, while minimizing costs.
Dip Your Toe in the Water
Seeing is believing. A demo instance of ThoughtSpot is available for trial and we are happy to walk you and your team through the power of this game-changing technology. RIP dashboard creation. Welcome to the world of automatic insights.
For more information or to discuss in detail, please reach out to info@greatdataminds.com.


